
 个人中心
个人中心 退出
退出


Leaflet 实现 使用GeoJSON进行行政区域剪裁,非矢量图层覆盖
前几天利用OpenLayers做了一个使用GeoJSON数据按行政区域剪裁栅格图层的案例,然后有使用Leaflet的朋友也想实现这样的效果。好在Leaflet有一个插件是专门干这个的:
戳我直达项目地址
使用起来很简单,就是准备好GeoJSON的数据,初始化图层,加到地图上:
var osm = new L.TileLayer.BoundaryCanvas(tileLayerUrl, options);
map.addLayer(osm);
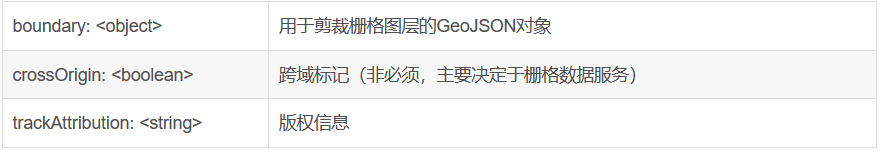
第一个参数是栅格图层的资源地址,第二个参数是配置选项,意义如下:
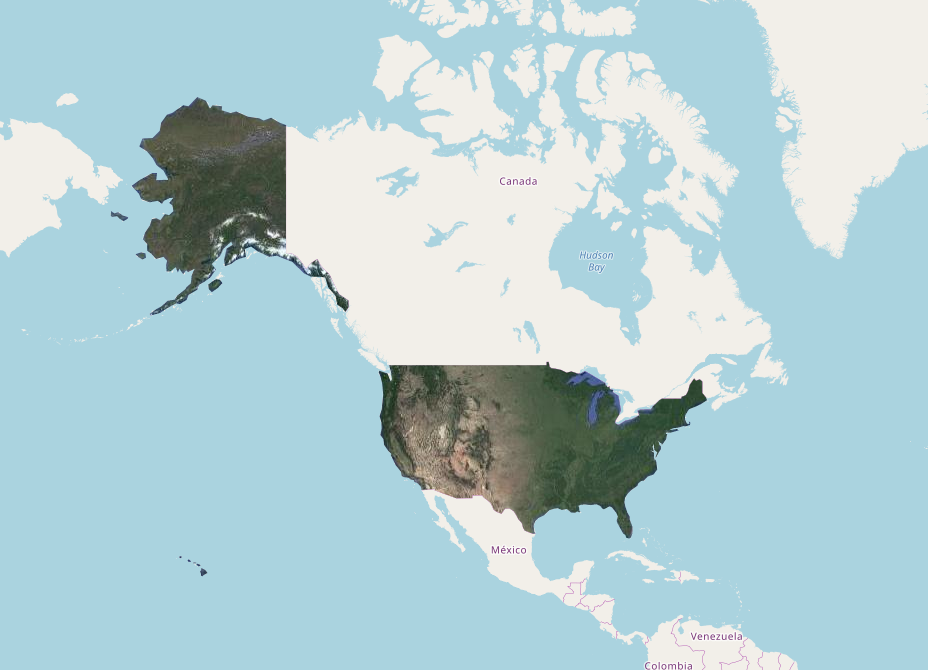
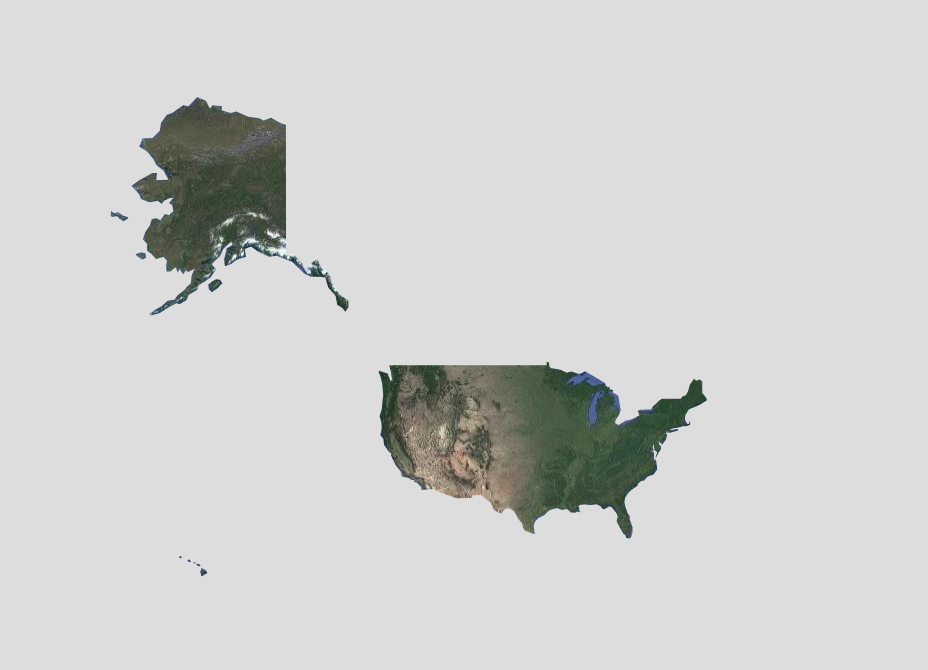
本文选择了一个google卫星地图作为剪裁层,OSM政区图作为底图。效果如下:
代码:
<!DOCTYPE html>
<html lang="en">
<head>
<meta charset="UTF-8">
<title>Title</title>
<link rel="stylesheet" href="https://unpkg.com/leaflet@1.5.1/dist/leaflet.css"
integrity="sha512-xwE/Az9zrjBIphAcBb3F6JVqxf46+CDLwfLMHloNu6KEQCAWi6HcDUbeOfBIptF7tcCzusKFjFw2yuvEpDL9wQ=="
crossorigin="" />
<style type="text/css">
body {
padding: 0;
margin: 0;
}
html,
body,
#map {
height: 100%;
}
</style>
<!-- Make sure you put this AFTER Leaflet's CSS -->
<script src="https://unpkg.com/leaflet@1.5.1/dist/leaflet.js"
integrity="sha512-GffPMF3RvMeYyc1LWMHtK8EbPv0iNZ8/oTtHPx9/cc2ILxQ+u905qIwdpULaqDkyBKgOaB57QTMg7ztg8Jm2Og=="
crossorigin=""></script>
<script src="./js/BoundaryCanvas.js"></script>
</head>
<body>
<div id="map" style="height: 100%"></div>
</body>
</html>
<script type="text/javascript">
var map = L.map('map').setView([54.775346, -105.996094], 3);
var osmUrl = 'http://{s}.tile.osm.org/{z}/{x}/{y}.png';
var googleUrl = 'http://www.google.cn/maps/vt?lyrs=s@189&gl=cn&x={x}&y={y}&z={z}';
var osmAttribution = 'Map data © 2012 OpenStreetMap contributors';
L.tileLayer(osmUrl, {
attribution: 'google'
}).addTo(map);
fetch("./data/USA.geojson").then(function (res) {
return res.json();
}).then(function (json) {
L.TileLayer.boundaryCanvas(googleUrl, {
boundary: json.features[0],
attribution: osmAttribution
}).addTo(map);
})
</script>
 分类导航
分类导航